Bubble chart
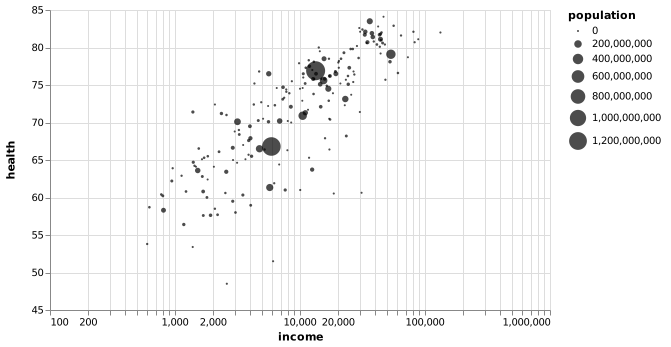
Point position shows two measures; circle area adds a third.
Six neighborhood cafés
Horizontal: seats. Circle area in the bubble view: orders per day.
Illustrative dataView data6 records
| Item | Seats | Wait (minutes) | Orders / day |
|---|---|---|---|
| Elm | 12 | 9 | 80 |
| Oak | 24 | 14 | 160 |
| Pine | 32 | 11 | 120 |
| Fern | 42 | 22 | 300 |
| Moss | 58 | 24 | 240 |
| Reed | 68 | 18 | 180 |
When it fits
Add the scale of each observation to a relationship.
What you need
Two numeric coordinates and a nonnegative size value.
Watch for
Scaling radius to value makes large quantities look disproportionately large.
In practice
Sources and accessibility
The authored example uses illustrative data. Published references retain their original information and presentation.
- Claus O. Wilke · Visualizing associations
- Vega-Lite contributors · Health and income across countries
- W3C WAI · Accessible descriptions for complex images
Use Tab to reach controls and the data view. Native selects support arrow keys. All values are available in the data view; color and hover are never the only way to read the example.