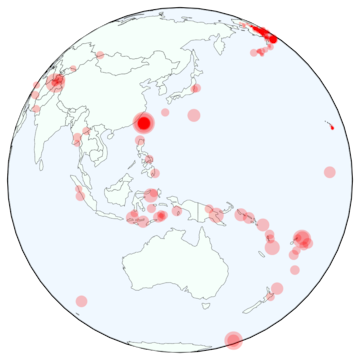
Proportional-symbol map
Symbol areas represent amounts at geographic locations.
A city’s public gardens
Garden visits per week in fictional districts. Circle area represents visits.
Illustrative dataView data6 records
| Item | Within 10 min (%) | Visits / week |
|---|---|---|
| North | 35 | 120 |
| Hill | 62 | 80 |
| Harbor | 48 | 260 |
| West | 78 | 160 |
| Central | 88 | 320 |
| South | 54 | 200 |
When it fits
Compare counts while retaining geographic context.
What you need
Locations and nonnegative amounts.
Watch for
Large overlapping symbols can hide nearby locations.
In practice
Sources and accessibility
The authored example uses illustrative data. Published references retain their original information and presentation.
- Claus O. Wilke · Geospatial data
- Vega contributors · Earthquake locations and magnitude
- W3C WAI · Accessible descriptions for complex images
Use Tab to reach controls and the data view. Native selects support arrow keys. All values are available in the data view; color and hover are never the only way to read the example.