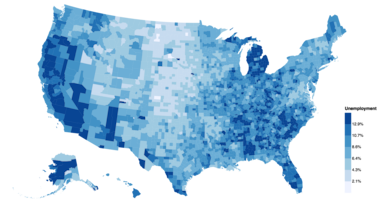
Choropleth map
Geographic areas are shaded by a comparable rate or share.
A city’s public gardens
Darker shading means a larger share of residents.
Share of residents within a 10-minute walk of a public garden. Fictional districts.
Illustrative dataView data6 records
| Item | Within 10 min (%) | Visits / week |
|---|---|---|
| North | 35 | 120 |
| Hill | 62 | 80 |
| Harbor | 48 | 260 |
| West | 78 | 160 |
| Central | 88 | 320 |
| South | 54 | 200 |
When it fits
Find regional patterns in a normalized measure.
What you need
Area boundaries and values with a consistent denominator.
Watch for
Raw totals often show population size rather than the phenomenon of interest.
In practice
Sources and accessibility
The authored example uses illustrative data. Published references retain their original information and presentation.
- Claus O. Wilke · Geospatial data
- Vega contributors · US county unemployment rates, 2009
- W3C WAI · Accessible descriptions for complex images
Use Tab to reach controls and the data view. Native selects support arrow keys. All values are available in the data view; color and hover are never the only way to read the example.