Heatmap
Color intensity shows values across a matrix.
Library visits per hour
Illustrative data
View data20 records
| Item | Group | Visits per hour |
|---|---|---|
| Mon | 10am | 12 |
| Mon | Noon | 20 |
| Mon | 2pm | 32 |
| Mon | 4pm | 26 |
| Tue | 10am | 18 |
| Tue | Noon | 24 |
| Tue | 2pm | 42 |
| Tue | 4pm | 30 |
| Wed | 10am | 14 |
| Wed | Noon | 28 |
| Wed | 2pm | 36 |
| Wed | 4pm | 22 |
| Thu | 10am | 22 |
| Thu | Noon | 32 |
| Thu | 2pm | 48 |
| Thu | 4pm | 40 |
| Fri | 10am | 16 |
| Fri | Noon | 30 |
| Fri | 2pm | 44 |
| Fri | 4pm | 28 |
When it fits
Find recurring high and low regions in a dense grid.
What you need
Two grouping variables and one numeric value per cell.
Watch for
Color is poor at communicating small, exact differences.
In practice
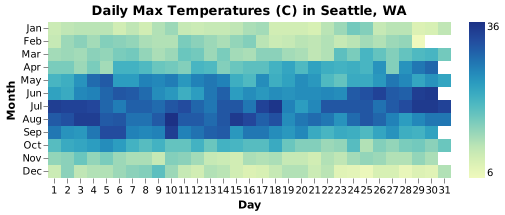
Sources and accessibility
The authored example uses illustrative data. Published references retain their original information and presentation.
- Claus O. Wilke · Visualizing amounts
- Vega-Lite contributors · Seattle weather through the year
- W3C WAI · Accessible descriptions for complex images
Use Tab to reach controls and the data view. Native selects support arrow keys. All values are available in the data view; color and hover are never the only way to read the example.