Small multiples
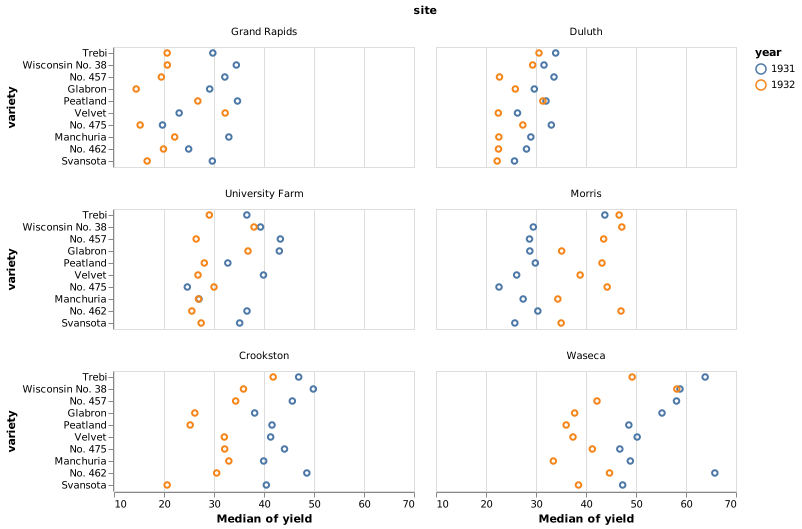
Repeated charts give each series its own space.
Listening through the week
Illustrative data
View data12 records
| Item | Group | Sessions (thousands) |
|---|---|---|
| Mon | Mobile | 32 |
| Mon | Web | 20 |
| Tue | Mobile | 48 |
| Tue | Web | 24 |
| Wed | Mobile | 42 |
| Wed | Web | 38 |
| Thu | Mobile | 68 |
| Thu | Web | 32 |
| Fri | Mobile | 76 |
| Fri | Web | 48 |
| Sat | Mobile | 56 |
| Sat | Web | 66 |
When it fits
Compare several trends without overlapping lines.
What you need
Comparable groups, shared units, and aligned scales.
Watch for
Independent scales can make very different magnitudes look similar.
In practice
Sources and accessibility
The authored example uses illustrative data. Published references retain their original information and presentation.
- Claus O. Wilke · Visualizing amounts
- Vega-Lite contributors · Becker’s barley trial
- W3C WAI · Accessible descriptions for complex images
Use Tab to reach controls and the data view. Native selects support arrow keys. All values are available in the data view; color and hover are never the only way to read the example.