Line chart
Connected observations reveal change along an ordered axis.
Listening through the week
Illustrative data
View data6 records
| Item | Group | Sessions (thousands) |
|---|---|---|
| Mon | Mobile | 32 |
| Tue | Mobile | 48 |
| Wed | Mobile | 42 |
| Thu | Mobile | 68 |
| Fri | Mobile | 76 |
| Sat | Mobile | 56 |
When it fits
Follow a trend over time.
What you need
Time or another ordered variable, plus measured values.
Watch for
Joining across missing observations can imply measurements that do not exist.
In practice
Sources and accessibility
The authored example uses illustrative data. Published references retain their original information and presentation.
- Claus O. Wilke · Time series
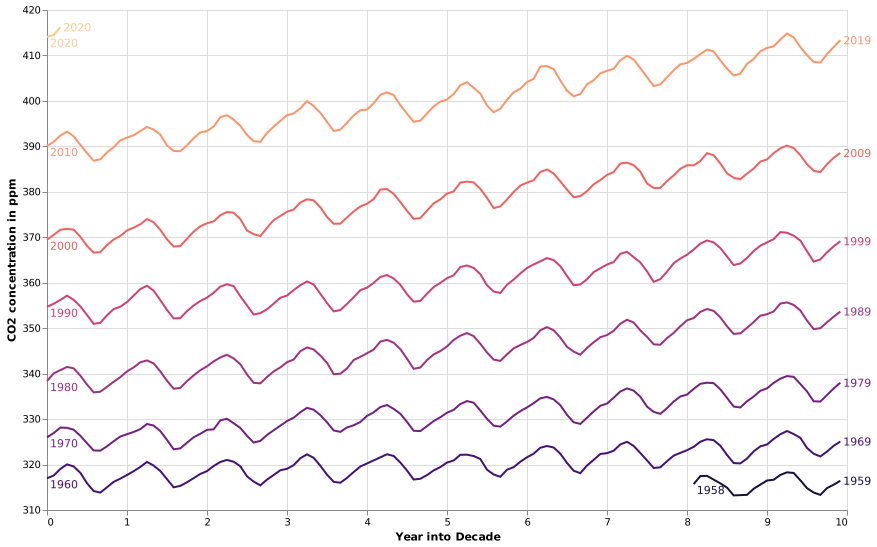
- Vega-Lite contributors · Atmospheric carbon dioxide
- W3C WAI · Accessible descriptions for complex images
Use Tab to reach controls and the data view. Native selects support arrow keys. All values are available in the data view; color and hover are never the only way to read the example.