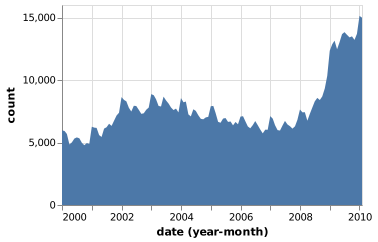
Area chart
A filled region emphasizes magnitude over time.
Listening through the week
Illustrative data
View data6 records
| Item | Group | Sessions (thousands) |
|---|---|---|
| Mon | Mobile | 32 |
| Tue | Mobile | 48 |
| Wed | Mobile | 42 |
| Thu | Mobile | 68 |
| Fri | Mobile | 76 |
| Sat | Mobile | 56 |
When it fits
Show how the level of a quantity rises and falls.
What you need
Ordered observations of an amount with a meaningful zero.
Watch for
Overlapping filled series can hide one another.
In practice
Sources and accessibility
The authored example uses illustrative data. Published references retain their original information and presentation.
- Claus O. Wilke · Time series
- Vega-Lite contributors · Unemployment across industries
- W3C WAI · Accessible descriptions for complex images
Use Tab to reach controls and the data view. Native selects support arrow keys. All values are available in the data view; color and hover are never the only way to read the example.