Stacked bar
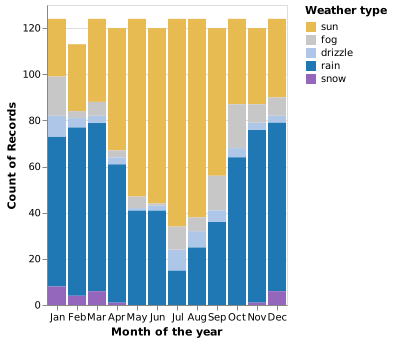
Segments divide each bar into its component amounts.
How people reach the library
Illustrative data
View data9 records
| Item | Group | Visits |
|---|---|---|
| North | Walk | 45 |
| North | Cycle | 30 |
| North | Transit | 25 |
| Harbor | Walk | 24 |
| Harbor | Cycle | 36 |
| Harbor | Transit | 60 |
| West | Walk | 42 |
| West | Cycle | 18 |
| West | Transit | 30 |
When it fits
Compare totals and the composition of each total.
What you need
Nonnegative components that add to a meaningful whole.
Watch for
Middle segments lack a shared baseline, which makes close comparisons difficult.
In practice
Sources and accessibility
The authored example uses illustrative data. Published references retain their original information and presentation.
- Claus O. Wilke · Visualizing proportions
- Vega-Lite contributors · Weather conditions by month
- W3C WAI · Accessible descriptions for complex images
Use Tab to reach controls and the data view. Native selects support arrow keys. All values are available in the data view; color and hover are never the only way to read the example.