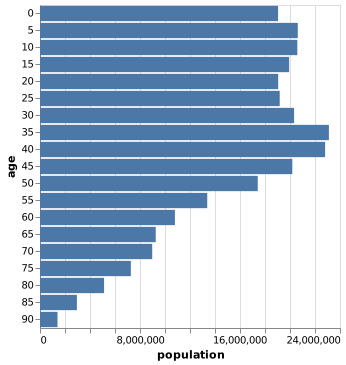
Bar chart
Lengths compare amounts from a common baseline.
Evening class registrations
Illustrative data
View data6 records
| Item | Group | Registrations |
|---|---|---|
| Clay | Studio | 48 |
| Studio | 32 | |
| Photo | Studio | 40 |
| Bread | Kitchen | 36 |
| Pasta | Kitchen | 28 |
| Ferment | Kitchen | 16 |
When it fits
Compare amounts across named categories.
What you need
One value per category, in the same unit.
Watch for
A shortened baseline exaggerates differences in bar length.
In practice
Sources and accessibility
The authored example uses illustrative data. Published references retain their original information and presentation.
- Claus O. Wilke · Visualizing amounts
- Vega-Lite contributors · US population by age
- W3C WAI · Accessible descriptions for complex images
Use Tab to reach controls and the data view. Native selects support arrow keys. All values are available in the data view; color and hover are never the only way to read the example.