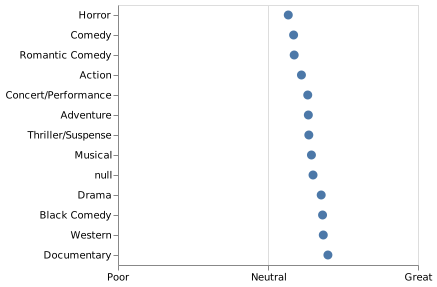
Dot plot
Position places each value on a shared scale.
Evening class registrations
Illustrative data
View data6 records
| Item | Group | Registrations |
|---|---|---|
| Clay | Studio | 48 |
| Studio | 32 | |
| Photo | Studio | 40 |
| Bread | Kitchen | 36 |
| Pasta | Kitchen | 28 |
| Ferment | Kitchen | 16 |
When it fits
Show small differences between categories without heavy bars.
What you need
Named categories and a numeric value.
Watch for
An unfamiliar scale needs clear ticks and units.
In practice
Sources and accessibility
The authored example uses illustrative data. Published references retain their original information and presentation.
- Claus O. Wilke · Visualizing amounts
- Vega-Lite contributors · Average film ratings by genre
- W3C WAI · Accessible descriptions for complex images
Use Tab to reach controls and the data view. Native selects support arrow keys. All values are available in the data view; color and hover are never the only way to read the example.