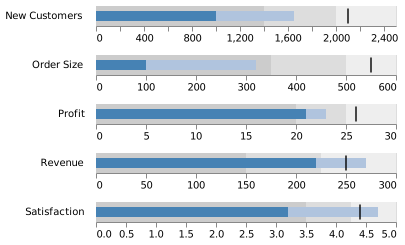
Bullet chart
A bar measures progress against a marked target.
First-project activation
Bar: actual activation rate. Vertical mark: target. Both use the same percentage scale.
Share of new accounts that complete a first project within seven days.
Illustrative dataView data4 records
| Item | Activated (%) | Target |
|---|---|---|
| Web | 52 | 60 |
| iOS | 68 | 75 |
| Android | 64 | 80 |
| Desktop | 60 | 65 |
When it fits
Check several measures against their own targets.
What you need
An actual value and a target on the same scale. Performance ranges are optional.
Watch for
Shaded ranges need meaningful thresholds for the measure; there is no standard percentage of target.
In practice
Sources and accessibility
The authored example uses illustrative data. Published references retain their original information and presentation.
- Stephen Few · Bullet Graph Design Specification
- Vega-Lite contributors · Business measures and targets
- W3C WAI · Accessible descriptions for complex images
Use Tab to reach controls and the data view. Native selects support arrow keys. All values are available in the data view; color and hover are never the only way to read the example.