Slope chart
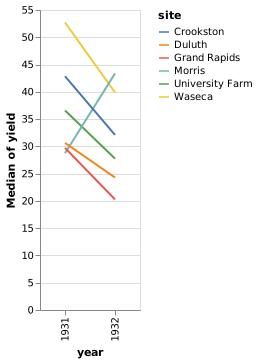
Lines connect values at two points in time.
Library workshops
Previous: spring. Current: autumn.
Illustrative dataView data4 records
| Item | Spring | Autumn | Target |
|---|---|---|---|
| North | 32 | 52 | 60 |
| Harbor | 56 | 68 | 75 |
| Central | 72 | 64 | 80 |
| West | 40 | 60 | 65 |
When it fits
See which categories rose, fell, or crossed between endpoints.
What you need
Two time points with the same measure for every category.
Watch for
Crowded crossings and end labels quickly become hard to follow.
In practice
Sources and accessibility
The authored example uses illustrative data. Published references retain their original information and presentation.
- Financial Times · Visual Vocabulary
- Vega-Lite contributors · Barley yield by site, 1931–1932
- W3C WAI · Accessible descriptions for complex images
Use Tab to reach controls and the data view. Native selects support arrow keys. All values are available in the data view; color and hover are never the only way to read the example.